 Leadership Cockpit
Wound Care KPI Dashboard — Replace Your Monthly Board Report
When your data is spread across 7 tools, leadership decisions are based on guesses and gut checks. The Medipyxis Leadership Cockpit gives executives, administrators, and operations leaders a single real-time view of everything that matters.
Real-time
Referral analytics
Live
Financial performance
Auto
Compliance alerts
6 views
One dashboard
<1%
Target graft denial rate*
with LCD guardrails
Guided
LCD-compliant charting*
templates capture every required data point
AI-routed
Referral intake*
OCR + auto-verification + clinician assignment
7-to-1
Tool consolidation
one platform replaces the typical stack
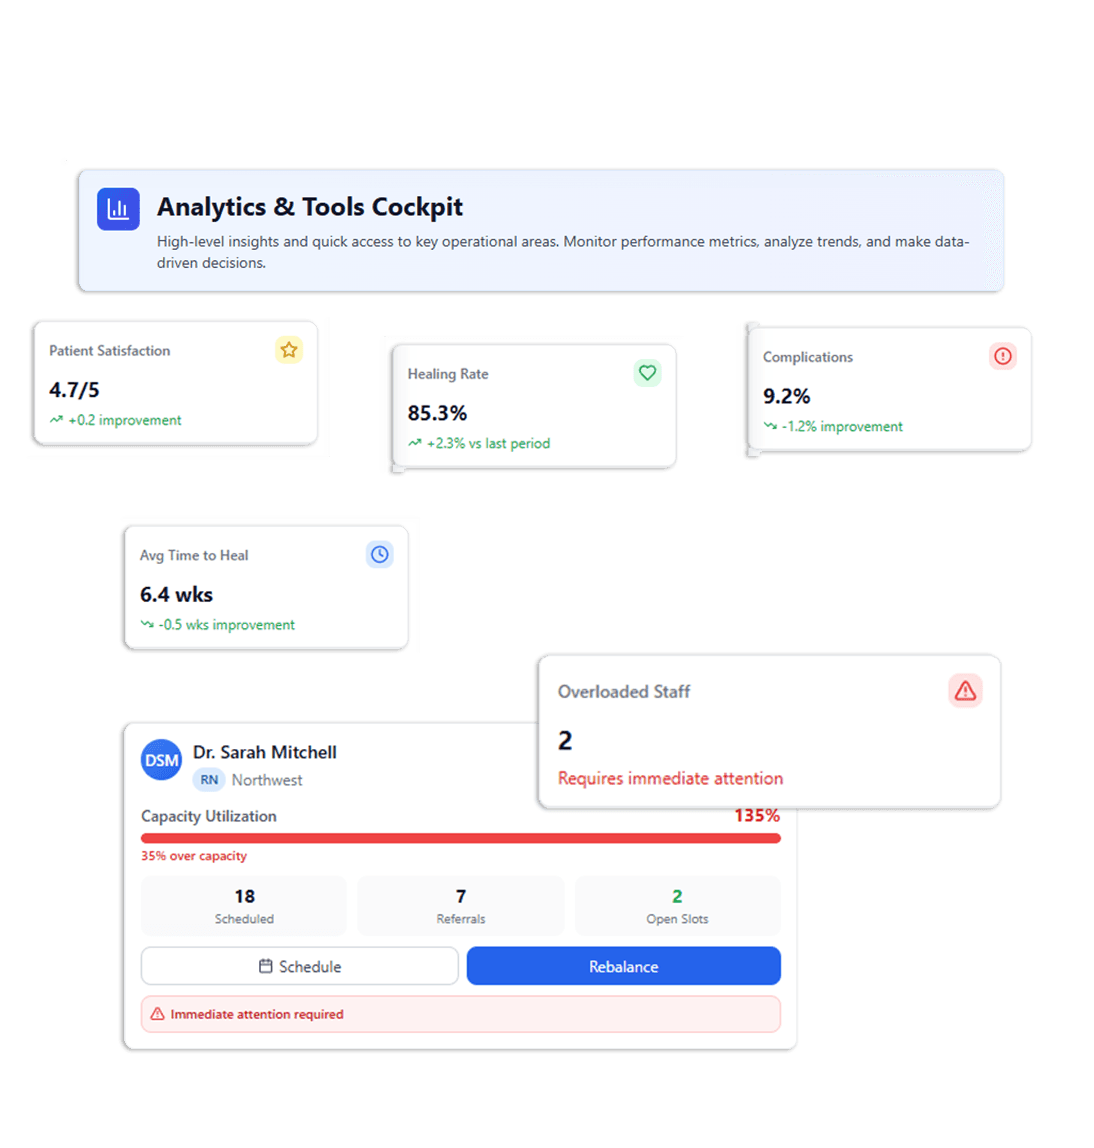
Clinical and Operational Metrics — At a Glance
The Leadership Cockpit surfaces every critical metric your executive team needs — from patient outcomes to staff workload — without toggling between reports or waiting for month-end exports.
Patient Satisfaction Tracking
Aggregate satisfaction scores reported across locations and clinicians to identify experience gaps.
Wound Healing Progress Visibility
Surface clinician-documented healing progress data by wound type, clinician, and treatment protocol. Healing outcomes are determined by clinical care, not by the software.
Complication Flag Visibility
Display clinician-documented complications across your patient population so trends can be reviewed by clinical leadership.
Workload Alerts
Alerts when clinician workload exceeds configured thresholds — designed to help leadership intervene early.
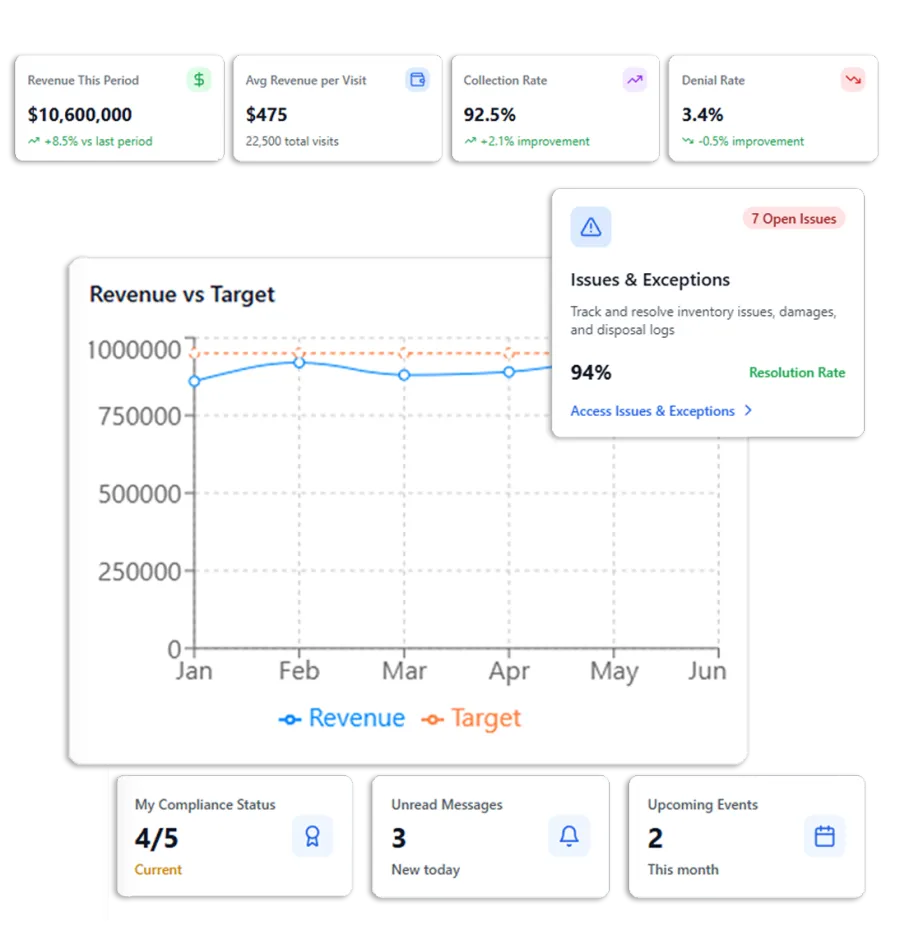
Live KPI and ROI Tracking
Revenue targets, graft ROI, and operational KPIs update in real time as data flows from visits, billing, and inventory. No manual dashboards. No stale spreadsheets.
- ✓Revenue vs. target by location, clinician, and payer — updated live
- ✓Graft spend vs. reimbursement with per-product margin analysis
- ✓Denial rate trends and A/R days broken down by payer
- ✓Referral conversion rates and intake response times
- ✓Clinician productivity and utilization benchmarks
Total Referrals This Month
247
Avg. Response Time
9.4 min
Conversion Rate
94%
Active Referring Providers
38
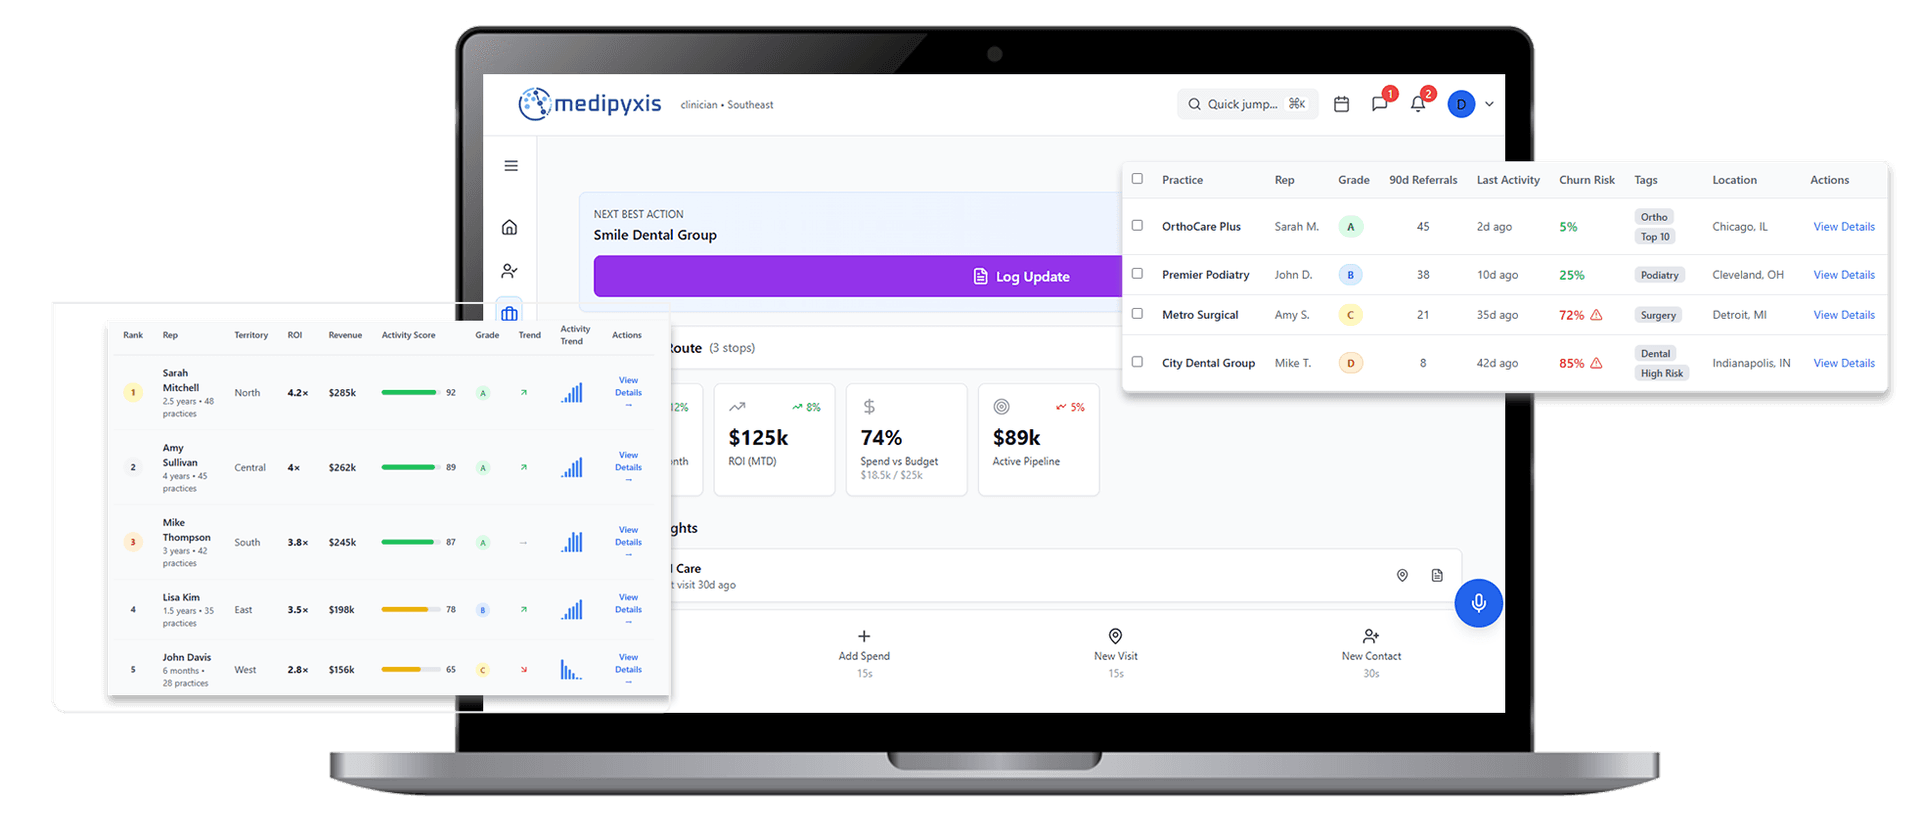
Referral Network Health — Know Where Patients Come From
Your referring provider relationships are your growth engine. The Leadership Cockpit tracks every referral source so you can identify your highest-value relationships and find the ones that need attention before volume starts to fall.
- ✓Referral volume by source, month, and territory
- ✓Referral-to-scheduled conversion rate per provider
- ✓Average intake response time by source
- ✓Referral trend charts — which sources are growing and which are declining
- ✓Provider engagement alerts for sources with declining volume
Financial Performance — Revenue, Denials, and A/R in Real Time
Leaders should not wait for monthly reports to understand financial performance. The Leadership Cockpit updates in real time as claims move through the revenue cycle.
Revenue by Clinician & Location
See which clinicians and locations are generating revenue and where productivity gaps exist.
Denial Rate & Trend
Track denial rates over time by payer and denial reason. Identify patterns before they become systemic.
Days in A/R
Monitor average days to payment by payer. Identify slow payers and prioritize follow-up.
Graft Spend & ROI
Track graft costs against reimbursement by product. Ensure utilization generates positive margin.
Compliance Status — Across Your Entire Team
The Leadership Cockpit surfaces credential status for every clinician with proactive expiration alerts so administrators can intervene before deadlines.
- ✓Current credential status for every clinician
- ✓Upcoming expirations in the next 90, 60, and 30 days
- ✓Clinicians with active scheduling blocks
- ✓Onboarding completion status for new hires
- ✓Policy acknowledgment completion rates
Outcome Tracking — Clinical Results at Scale
Track the clinical metrics that matter for value-based care relationships and operational quality improvement.
- ✓Wound healing rates by wound type and clinician
- ✓Average visits to wound closure
- ✓Hospital admission and re-admission rates
- ✓Patient retention and visit adherence
- ✓Outcome benchmarks across your locations and clinicians
AI Workload Balancing — No Clinician Overloaded, None Underutilized
The Leadership Cockpit exposes utilization gaps in real time. The AI assignment model uses this data to distribute new referrals across your team based on current load — not just availability.
Clinician Utilization by Day
See scheduled visit counts, actual completions, and open capacity for every clinician across every day.
Workload Rebalancing Recommendations
When load is uneven, the dashboard flags rebalancing opportunities and suggests reassignments based on geography and schedule.
Multi-Site Optimization
For multi-location practices, utilization data across all sites informs AI assignment, so no territory is chronically over or underserved.
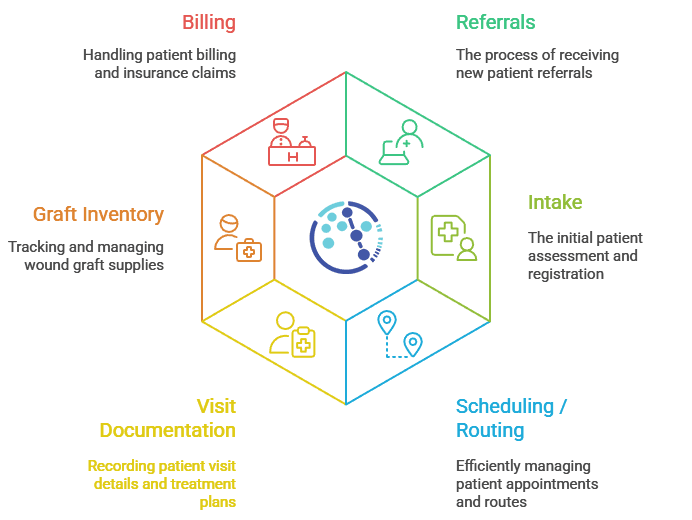
The Dashboard Is Powered by Every Module
EHR & Documentation
Visit data and outcomes feed the clinical performance and productivity metrics.
Referral Intake
Referral volume, conversion, and source analytics come directly from the intake pipeline.
Billing & Revenue Cycle
Financial performance, denial rates, and A/R data flow from the revenue cycle module.
Leadership Cockpit — Common Questions
See Your Operation in One Dashboard
Book a demo and walk through the Leadership Cockpit with a Medipyxis implementation specialist.